Forecast overview
- This edition of our Short-Term Energy Outlook (STEO) is the first to include forecasts for 2026. Macroeconomic assumptions are a key driver in the forecast. Our forecast assumes U.S. GDP will grow by 2% in both 2025 and 2026.
- Global oil prices. We expect downward oil price pressures over much of the next two years, as we expect that global oil production will grow more than global oil demand. We forecast that the Brent crude oil price will average $74 per barrel (b) in 2025, 8% less than in 2024, and then continue fall another 11% to $66/b in 2026.
- Global oil production. The unwinding of OPEC+ production cuts and strong growth in oil production outside of OPEC+ results in global oil production growing in our forecast. We expect global production of liquid fuels will increase by 1.8 million barrels per day (b/d) in 2025 and 1.5 million b/d in 2026. Although we forecast OPEC+ will increase production, we expect the group will produce less crude oil than stated in its most recent production target in an effort to avoid significant inventory builds. This forecast was completed before the United States issued additional sanctions targeting Russia’s oil sector on January 10, which have the potential to reduce Russia’s oil exports to the global market.
- U.S. crude oil production. After reaching an annual record of 13.2 million b/d in 2024, we forecast U.S. crude oil production will increase to 13.5 million b/d this year. We expect crude oil production to grow less than 1% in 2026, averaging 13.6 million b/d as operators slow activity due to price pressures. WTI prices average $62 per barrel in 2026 in our forecast, down from $70 per barrel in 2025. The Permian region’s share of U.S. production will continue to increase, accounting for more than 50% of all U.S. crude oil production in 2026. The expected production growth in the Permian in 2026 will be offset by contraction in other regions.
- Global oil consumption. Global oil consumption growth in our forecast continues to be less than the pre-pandemic trend. We expect global consumption of liquid fuels to increase by 1.3 million b/d in 2025 and 1.1 million b/d in 2026, driven by consumption growth in non-OECD countries. Much of our expected growth is in Asia, where India is now the leading source of global oil demand growth in our forecast.
- U.S. gasoline prices. Retail gasoline prices in our forecast for 2025 and 2026 are lower compared with 2024, which largely reflects our forecast of lower crude oil prices. We forecast U.S. gasoline prices in 2025 will average around $3.20 per gallon (gal), a decrease of more than 10 cents/gal from 2024. In 2026, we forecast prices to fall to an annual average $3.00/gal.
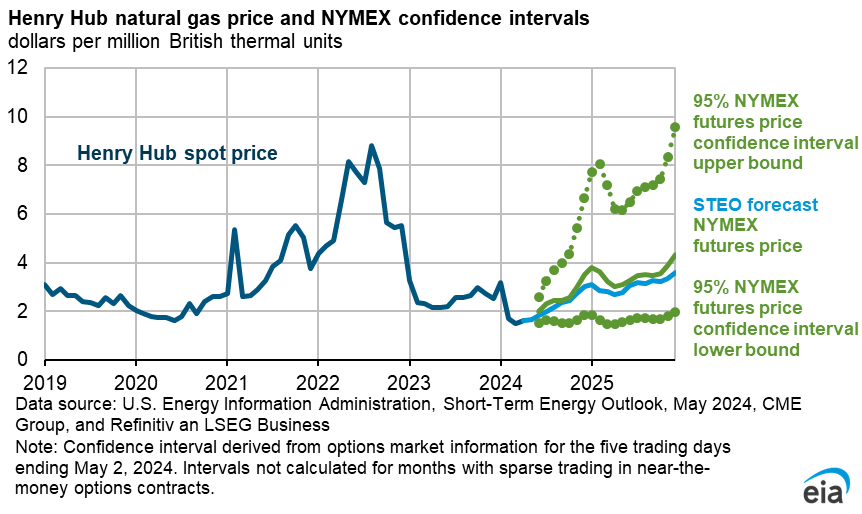
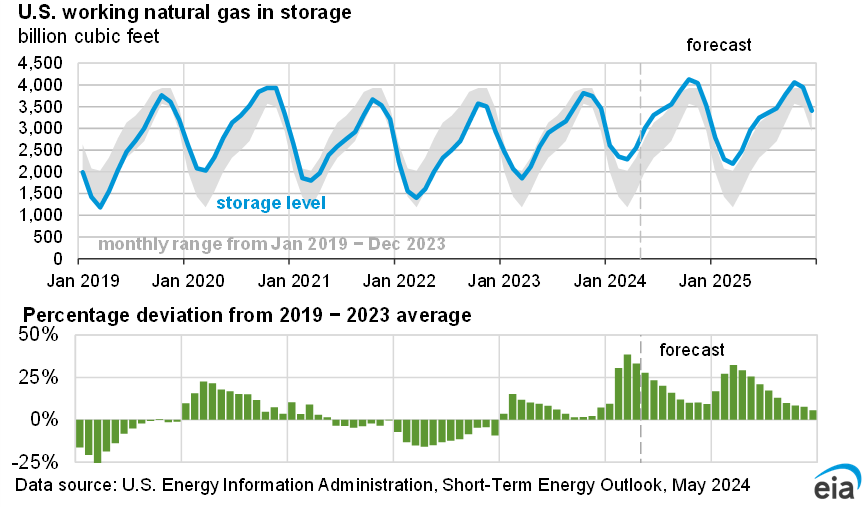
- Natural gas prices. The Henry Hub spot price generally rises over the next two years in our forecast. We expect the spot price of natural gas at Henry Hub to average $3.10 per million British thermal units (MMBtu) in 2025 and $4.00/MMBtu in 2026, up from an historically low average of around $2.20/MMBtu in 2024. We expect wholesale natural gas prices to increase because growth in demand—led by liquefied natural gas exports—outpaces production growth and keeps inventories during the next two years at or below their previous five-year averages during most of the forecast period.
- Electricity consumption. After almost two decades of relatively little change, consumption of electricity grew by 2% in the United States during 2024, and we forecast it will continue growing at that rate in 2025 and 2026. If electricity consumption grows in each of the next two years, it would mark the first three years of consecutive growth since 2005–07, though this result could be affected significantly by weather. The growth in electricity consumption in our forecast is mostly the result of growing power demand in the commercial and industrial sectors.
- Electricity generation. Solar power supplies most of the increase in U.S. generation in our forecast. We expect to see the addition of 26 gigawatts (GW) of new solar capacity in the U.S. electric power sector during 2025 and 22 GW in 2026. We expect these capacity additions will support the increase of U.S. solar generation by 34% in 2025 and by 17% in 2026. Rising generation from total renewables will cause natural gas generation to decline by 3% in 2025 and by another 1% in 2026. Generation from coal-fired power plants falls by 1% in 2025 and then rises slightly in 2026, as coal generators become more competitive with natural gas generators, which are expected to face rising fuel costs.
You can find more information in the detailed table of forecast changes.


