Natural gas
Natural gas storage and prices
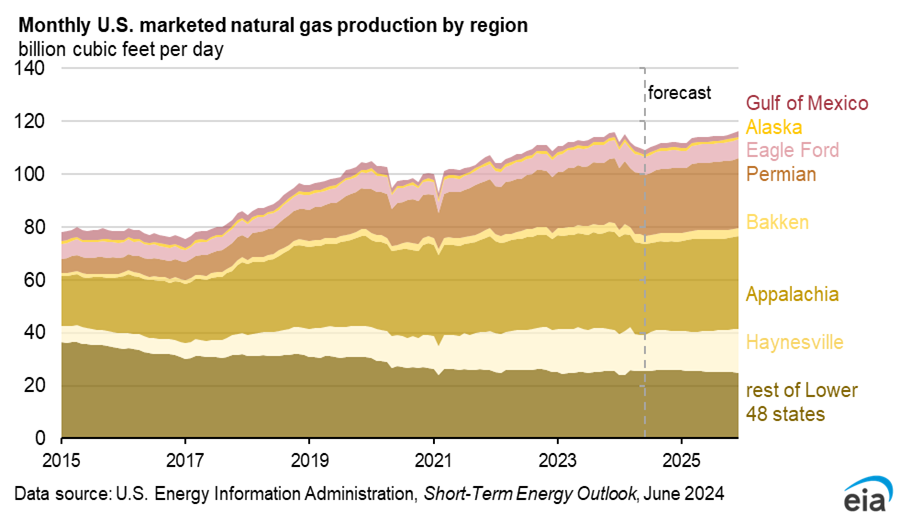
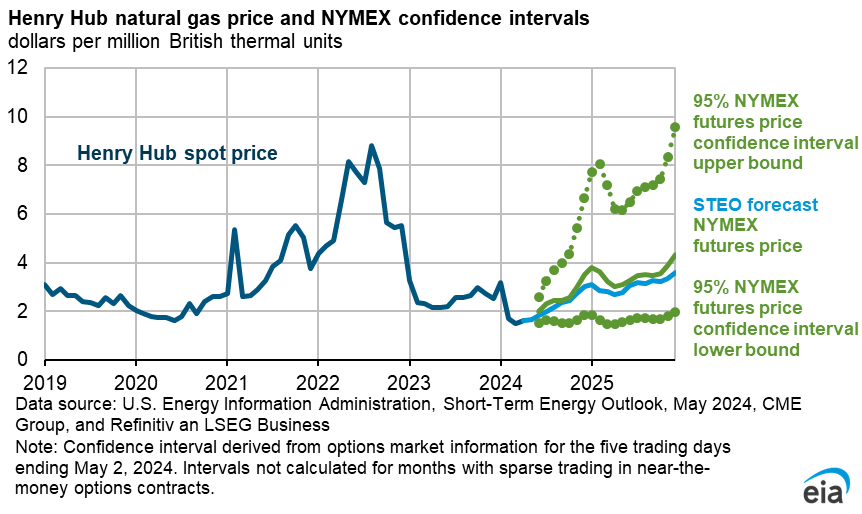
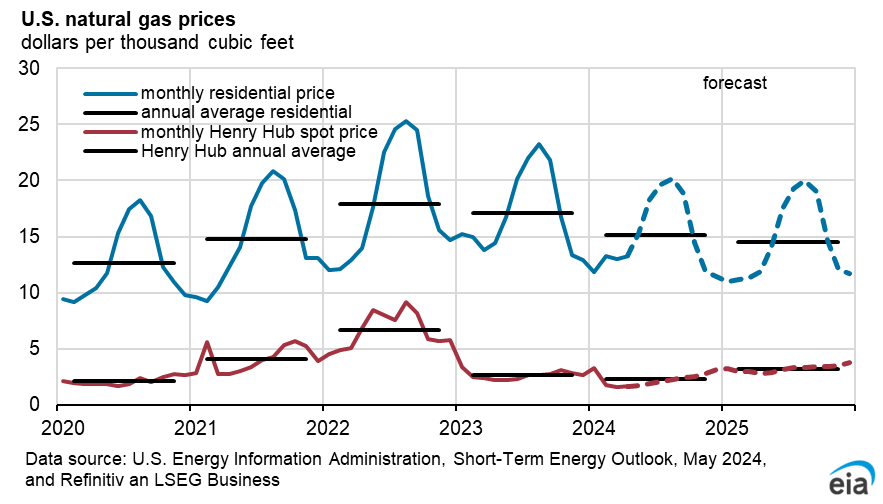
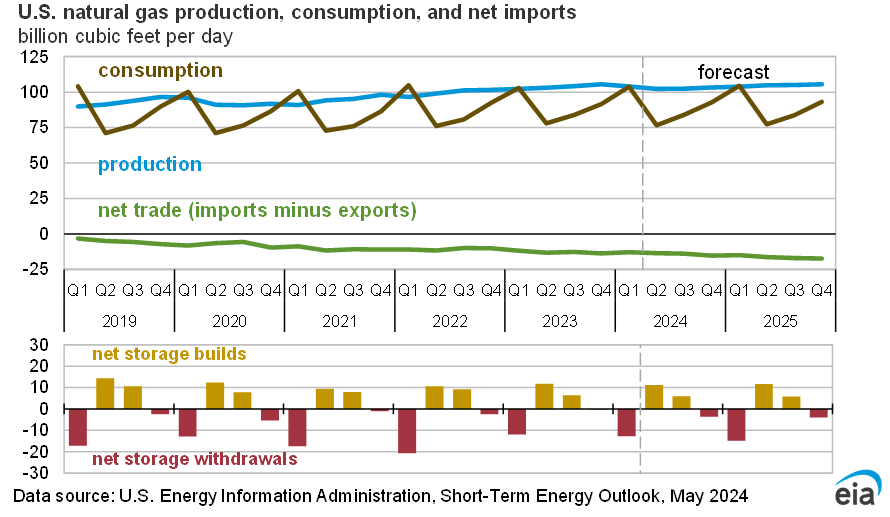
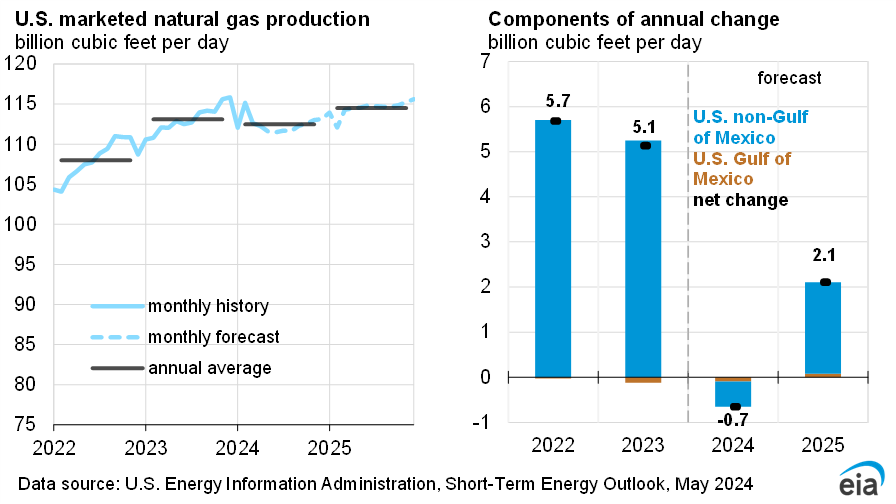
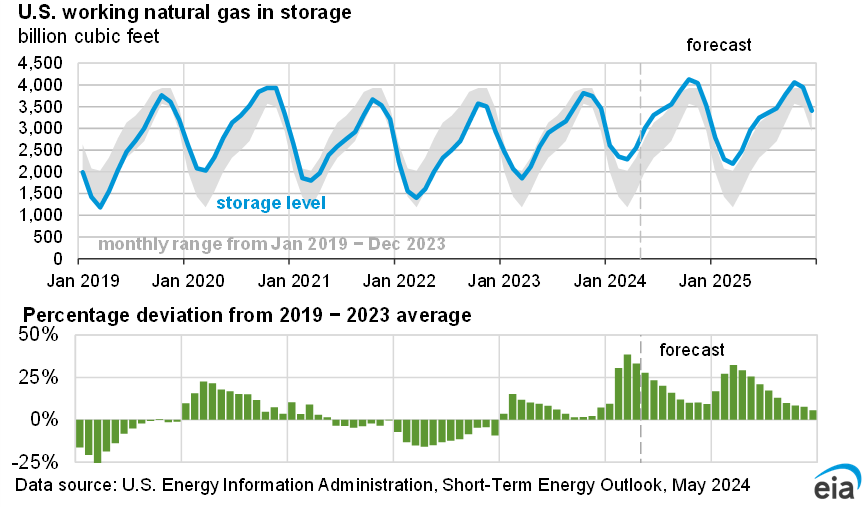
Natural gas inventories remain above the five-year average through much of our forecast, helping limit upward price pressures. Inventories remain relatively high because we expect record natural gas production, led by growth in the Permian region, to help meet rising demand. At the end of June, U.S. working natural gas inventories were 6% above the five-year average. We forecast U.S. working natural gas inventories will reach 3,966 billion cubic feet (Bcf) by the end of October, 5% above the five-year average. With above average inventories heading into winter, we expect the Henry Hub spot price in 4Q26 will average $3.57 per million British thermal units (MMBtu), which is 5% less than the same quarter last year. On the back of strong demand growth next year, we expect the inventory surplus to the five-year average will narrow to 1% at the end of October 2027. Henry Hub prices in 4Q27 average $3.78/MMBtu in our forecast, up 6% from 4Q26. For 2027 as a whole, we expect the Henry Hub price will average just under $3.50/MMBtu, down slightly from an average of close to $3.60/MMBtu in 2025 and 2026.
Consumption of natural gas in the electric power sector
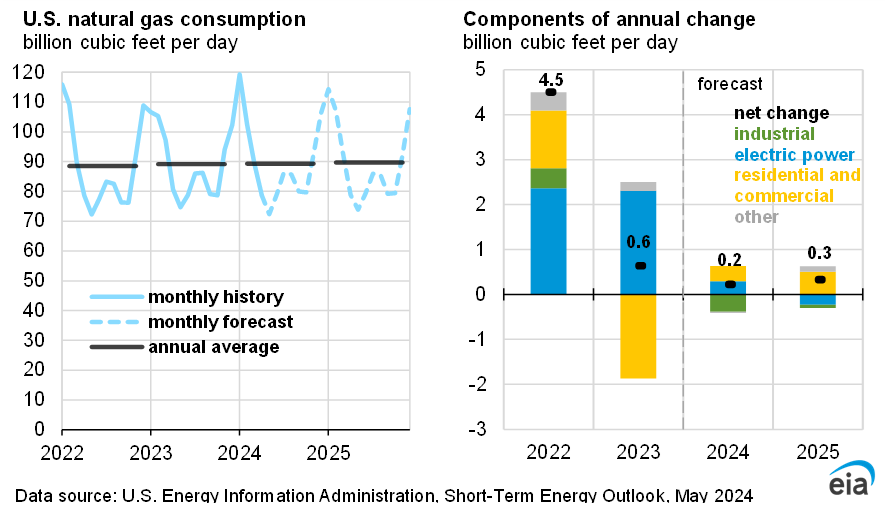
We forecast U.S. natural gas consumption in the electric power sector will increase in 2026 and 2027, reaching a record next year. Average consumption in the sector rises by 2% in 2026 and by another 4% in 2027 to 38.1 billion cubic feet per day (Bcf/d). On a monthly basis, we forecast consumption will reach 50.6 Bcf/d in July 2027, which would be the most in any month on record.
The increase in natural gas use for electric power generation is driven by rising overall electricity demand, additions to the natural gas generation fleet, and relatively low natural gas prices. Data reported by electricity generators show there will be 508 gigawatts of natural gas-fired generating capacity in the United States by the end of 2027, up 3% from 2025. Additionally, we expect the Henry Hub natural gas spot price to average close to $3.60/MMBtu over 2026 and 2027. Adjusted for inflation, that price is about 10% below the average Henry Hub price from 2016 through 2025.
Natural gas consumption in the electric power sector remains highest in the summer (June–September), when cooling demand raises electricity use and natural gas-fired generators are dispatched more often to meet peak demand. Although consumption peaks in summer, we forecast similar year-over-year proportional increases across much of the forecasted period. We expect consumption in the electric power sector will average 42.2 Bcf/d this summer, 0.5 Bcf/d more than during the same period in 2025. In 2027, we forecast summer consumption will average 46.3 Bcf/d, 2.1 Bcf/d more than in summer 2026.
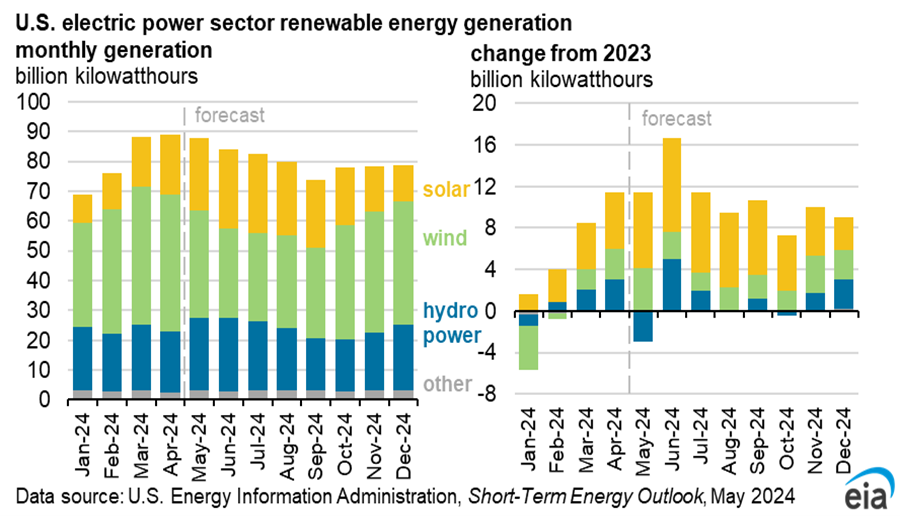
Renewable generation growth, particularly from solar, supplies much of the year-over-year increase in total U.S. electricity generation in our forecast. Natural gas-fired generation also increases, especially during times of high electricity demand and when renewable output is lower. This pattern is most evident in July and August, when temperatures and air-conditioning demand typically peak and natural gas consumption in this sector is highest.
We forecast total U.S. natural gas consumption will increase by 3.1 Bcf/d (3%) from 2025 to 2027. The electric power sector will increase by 2.3 Bcf/d (7%) over the same period. As we finalized this month’s outlook, an intense heatwave was settling across much of the eastern United States, which has the potential to raise the consumption of natural gas for power generation in the near term. Weather remains the main uncertainty in our forecast because changes in summer temperatures can significantly affect electricity demand and natural gas-fired generation.