Global oil markets
Global oil prices
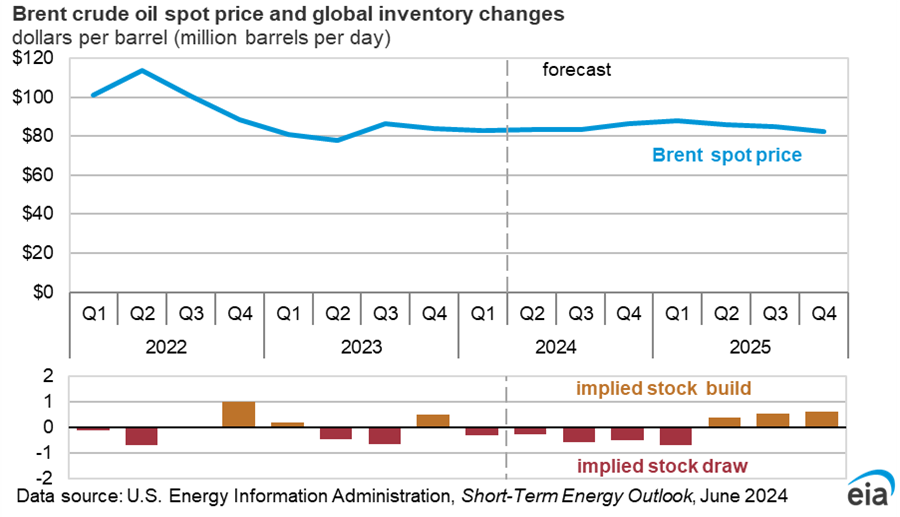
On June 18, the United States and Iran signed a memorandum of understanding (MOU) to end the conflict and open the Strait of Hormuz, which had been effectively closed since February 28 when the conflict began. The closure of the strait, a major world oil transit chokepoint, significantly disrupted global oil flows resulting in oil price volatility. The Brent crude oil spot price averaged $85 per barrel (b) in June, $22/b lower than the average in May. Daily Brent crude oil spot prices have since fallen even further, dropping below $70/b on July 1, similar to where prices were when the conflict began in late February.
Following the signing of the MOU, reports indicate a significant uptick in tanker traffic moving through the region to both load and deliver crude oil and petroleum products. The increase in oil flows through the strait has been a primary driver of downward pressure on oil prices in recent weeks.
The ability of global oil markets to adjust trade flows and swiftly reduce oil demand exceeded our expectations in earlier STEO forecasts. Most of this demand reduction occurred in Asia, where countries were most reliant on imports of crude oil from the Middle East. Other factors that helped moderate oil prices include the ability of some Persian Gulf oil producers to reroute supplies around the Strait of Hormuz, increased exports from crude oil producers outside of the Middle East (primarily in North and South America), and the release of strategic stocks from reserves in the United States and some OECD countries.
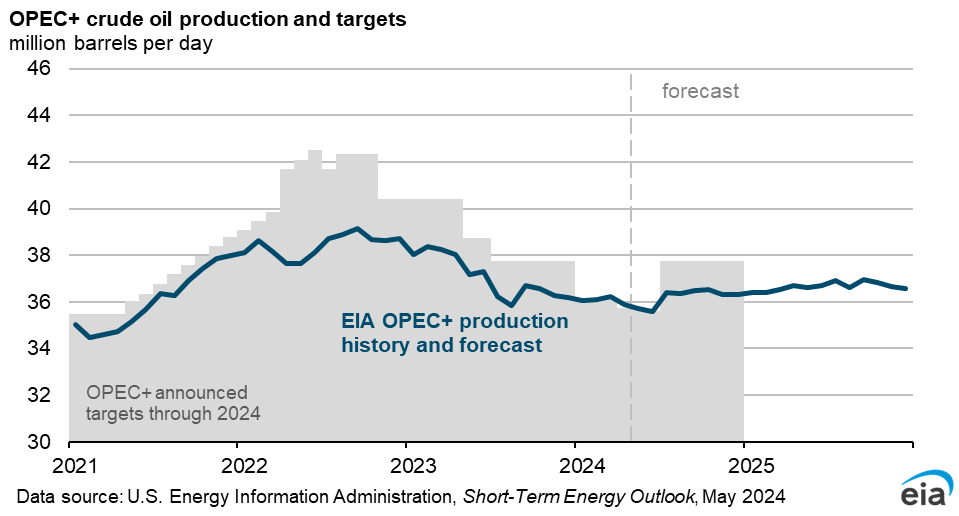
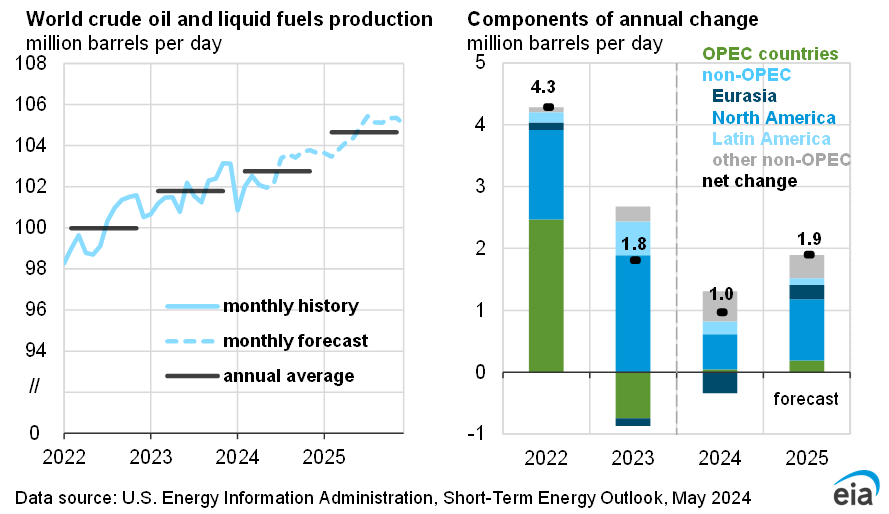
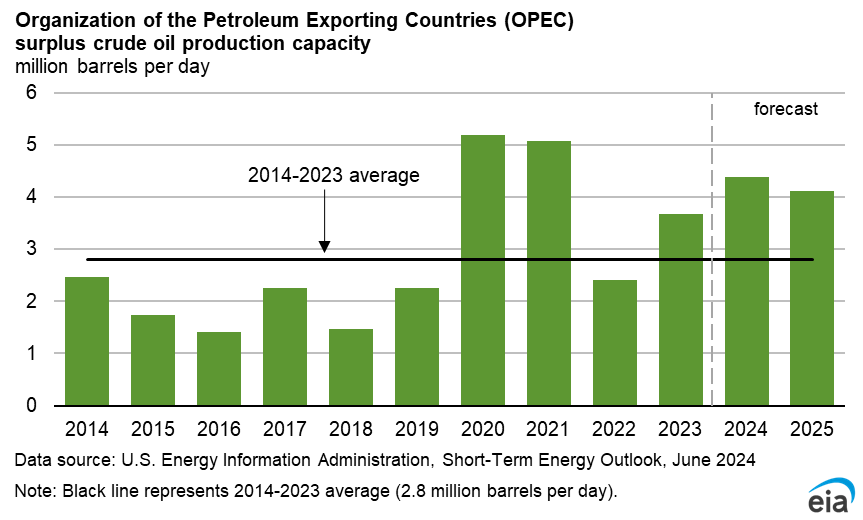
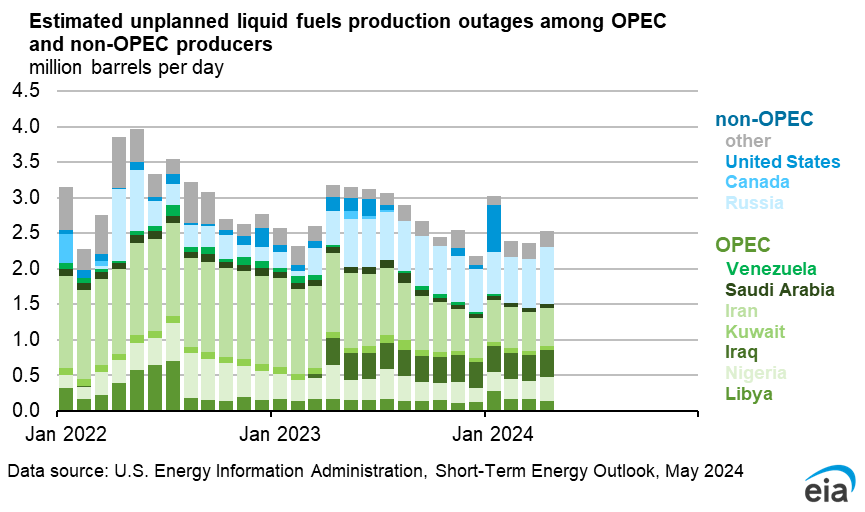
With the resumption of oil flows, we anticipate fewer disruptions to Middle East crude oil production than in our last forecast. We assess that production shut-ins averaged 8.3 million barrels per day (b/d) in June after peaking at 11.2 million b/d in May. We now expect most crude oil production and trade patterns to return to near pre-conflict levels by the end of this year, with an average of 1.4 million b/d of supply still shut-in in 4Q26 and the majority of shut-in crude oil production to be back online in 1Q27.
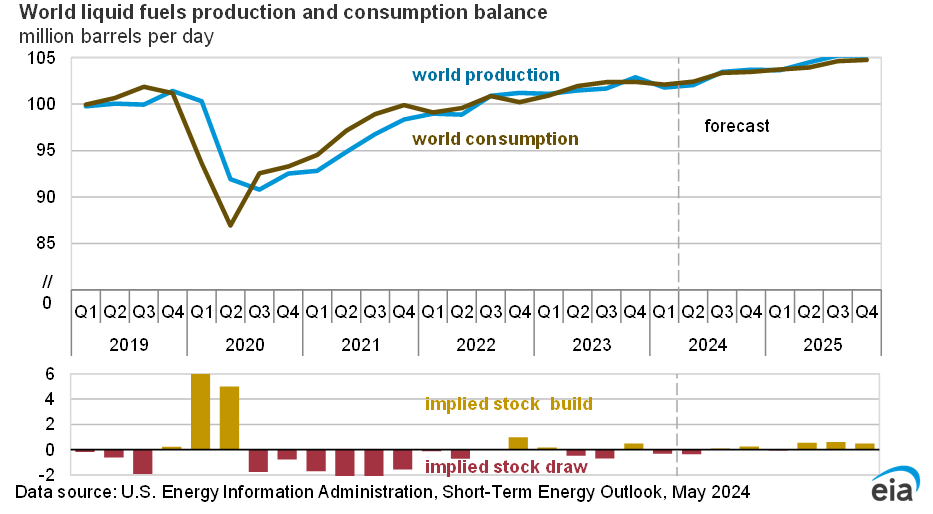
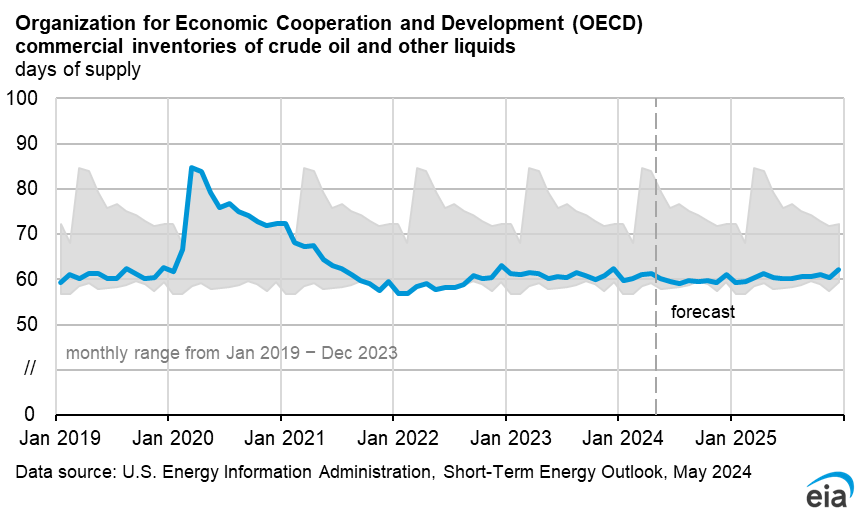
Despite rising oil production and exports from the Middle East in the coming months, it will take time to replenish considerably reduced global oil inventories and for production in the region to fully recover. We estimate that global oil inventories fell by an average of 5.1 million b/d in 2Q26 and will fall by an additional 2.2 million b/d in 3Q26. Inventory draws continue in 3Q26 because much of the increased tanker traffic is made up of previously stranded oil tankers both inside and outside of the strait.
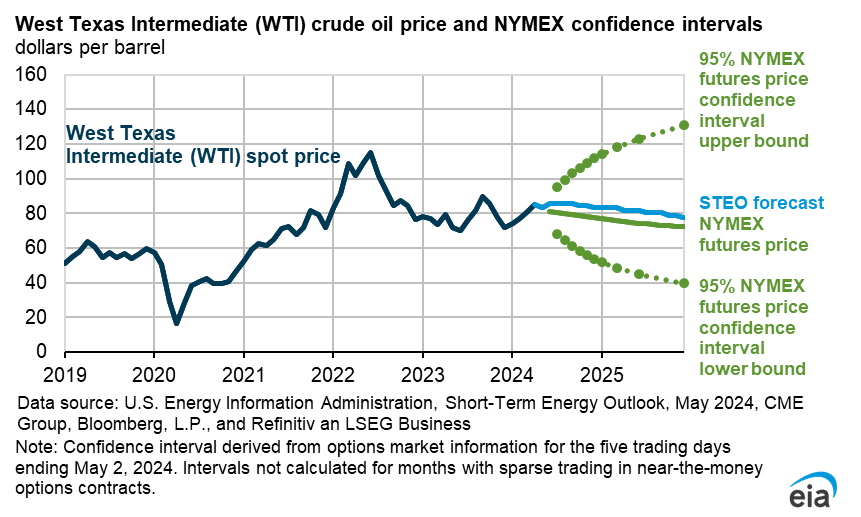
After this initial adjustment period, which will last for much of 3Q26, we expect that oil markets will return to the pre-conflict state of oversupply. We forecast oil inventories will build by an average of 2.7 million b/d in 4Q26 and 5.0 million b/d in 2027. As supply grows faster than consumption, we expect downward pressure on oil prices for the remainder of our STEO forecast. We expect that Brent crude oil prices will fall from an average of $103/b in 2Q26 to $70/b in 4Q26, which is $19/b lower than in our June STEO. Brent prices in our forecast average $65/b in 2027, $15/b lower than in our June STEO. Restocking strategic and commercial reserves will attenuate this decline in price.
Global oil consumption
We assess that high fuel prices during the conflict, fuel shortages, and government efforts to curtail fuel use have reduced oil demand in recent months, which has helped limit global oil inventory draws despite the loss of supply.
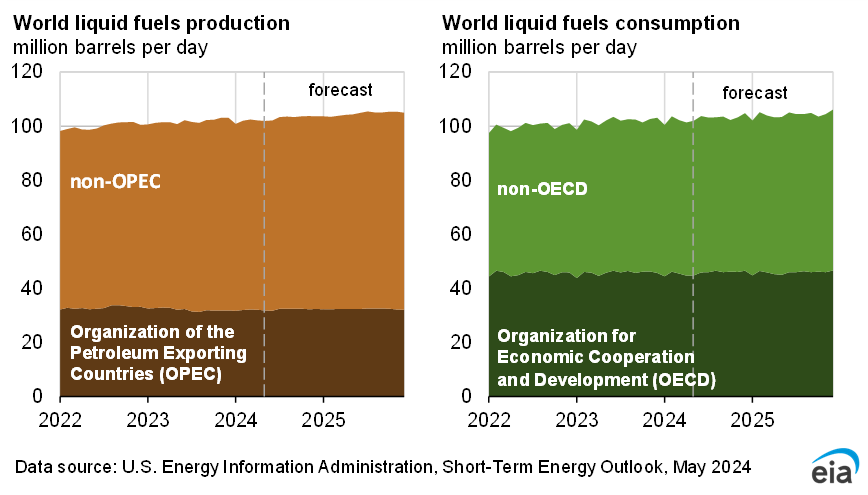
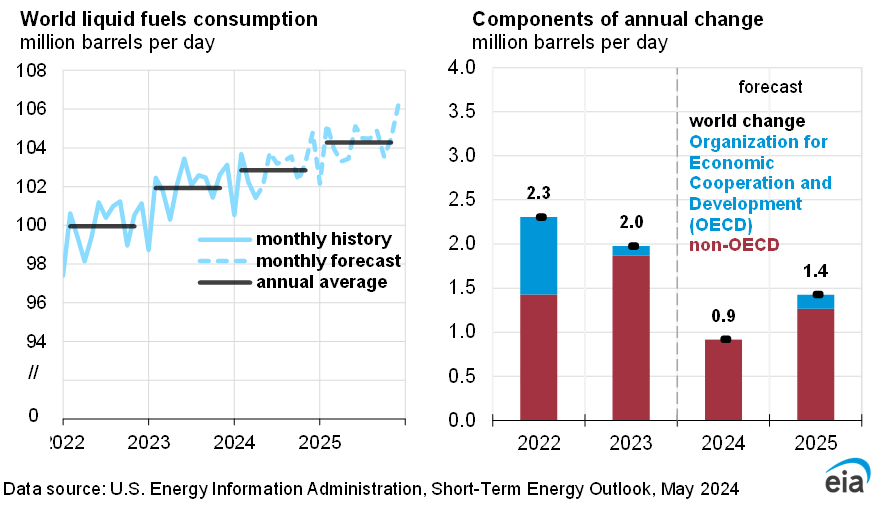
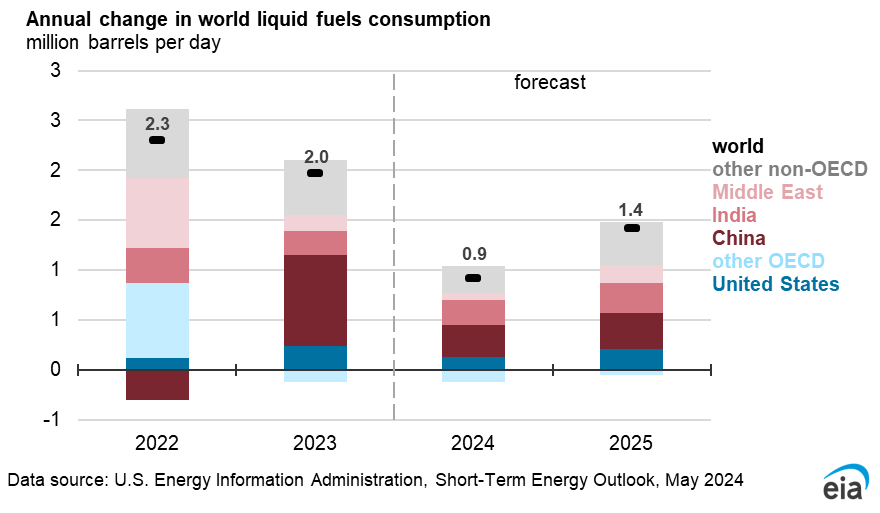
Although timely data on oil demand are limited, particularly for countries in Asia that have been the most affected by the closure of the Strait of Hormuz, indicators of liquid fuel consumption from organizations including the IEA, foreign governments, and other sources show that it has fallen significantly. We forecast that global oil consumption will decrease by an average of 1.2 million b/d in 2026, with 0.8 million b/d of this decrease coming from non-OECD countries. We assume, however, that oil demand will rebound next year once prices drop and supply flows fully return, with oil consumption growing by 2.0 million b/d in 2027 to 104.8 million b/d, 0.8 million b/d above the average in 2025.