Forecast overview
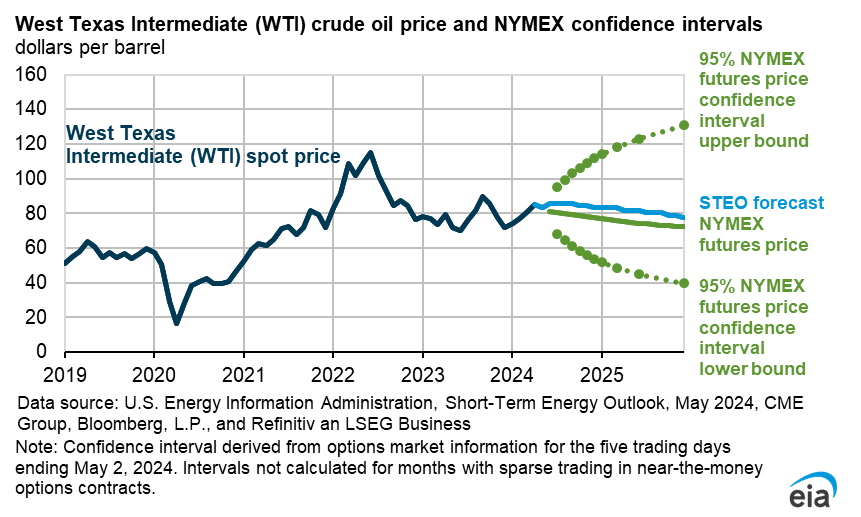
- Global oil inventories. We expect OPEC+ production cuts will reduce global oil inventories and keep crude oil prices near current levels through the first quarter of 2025. Gradual increases in production combined with relatively weak global oil demand growth will increase global oil inventories in the second half of 2025 through 2026, placing downward pressure on prices through the remainder of our forecast. As a result, we forecast that the Brent crude oil price will average $74 per barrel (b) in 2025 before falling to $66/b in 2026.
- Global oil production. We forecast global production of liquid fuels will increase by 1.9 million barrels per day (b/d) in 2025 and 1.6 million b/d in 2026 because of a combination of supply growth from countries outside of OPEC+ and the relaxation of OPEC+ production cuts. We do not anticipate that the sanctions on Russia's oil and shipping sectors announced on January 10 will significantly affect our oil production forecast.
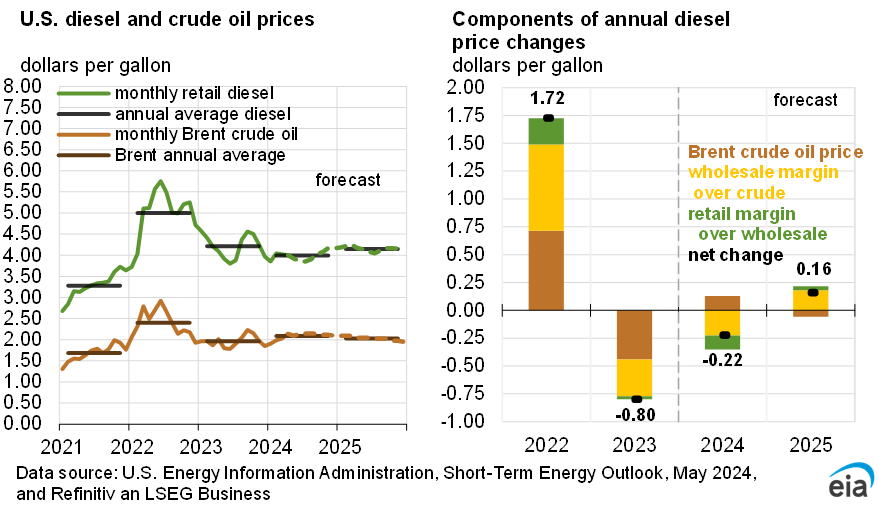
- U.S. petroleum products consumption. We expect U.S. distillate fuel oil consumption to increase by 4% in 2025 and remain flat in 2026 driven by GDP growth and increased industrial activity. We expect U.S. motor gasoline consumption to remain flat in 2025 as fuel efficiency gains outpace increases in driving. In 2026, we expect continued efficiency gains and slower employment growth will reduce gasoline consumption slightly.
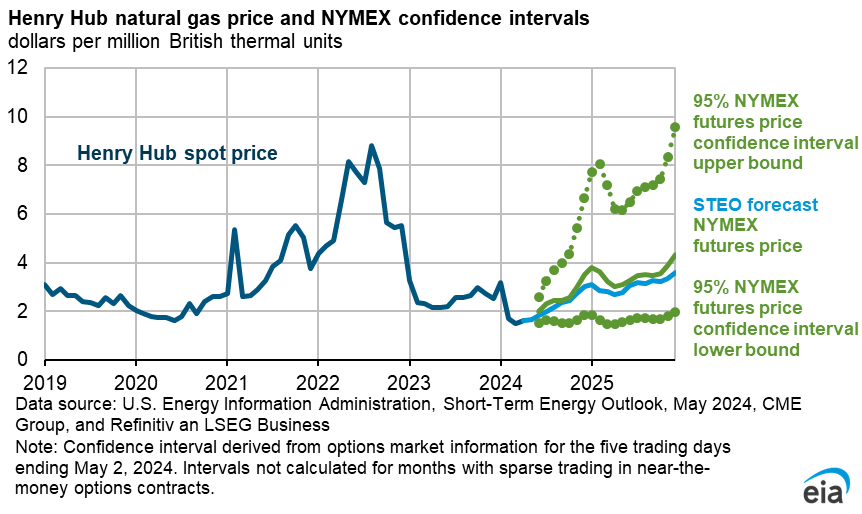
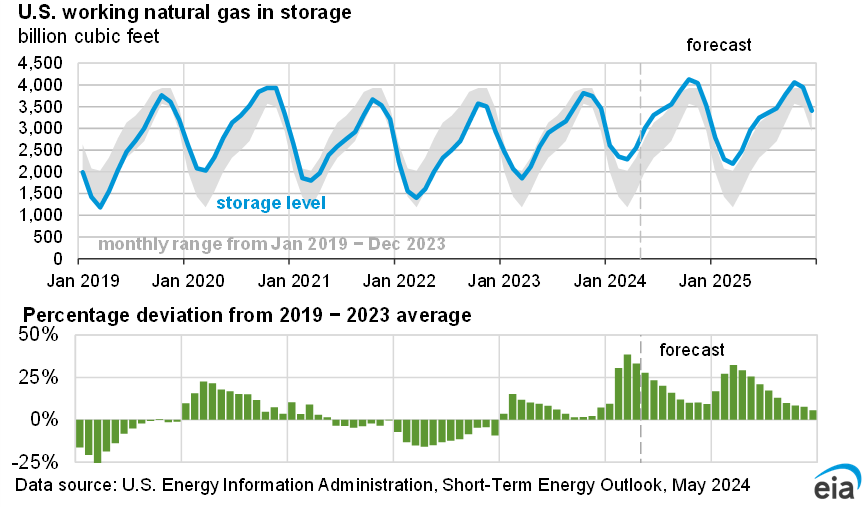
- Natural gas prices. The Henry Hub spot price averaged $4.13 per million British thermal units (MMBtu) in January and reached a daily high of $9.86/MMBtu on January 17 ahead of a cold snap that spread across the United States, leading to above-average inventory withdrawals. We expect the spot price to rise through 2026, averaging almost $3.80/MMBtu in 2025, up 65 cents from our January 2025 Short-Term Energy Outlook, and reach nearly $4.20/MMBtu in 2026.
- Electricity generation. We expect generation in the U.S. electric power sector to increase by 2% in 2025 and by 1% in 2026, after growing 3% last year, led by growth in renewable energy sources. If electricity generation grows in each of the next two years, it would mark the first three years of consecutive growth since 2005–07. The share of U.S. generation from solar grows from 5% in 2024 to 8% in 2026 because of an expected 45% increase in the amount of solar generating capacity between 2024 and 2026. Conversely, we expect the share of U.S. generation from natural gas to fall from 43% in 2024 to 39% in 2026 as natural gas prices rise. Our forecasts for increases in solar and wind generation are based on the planned generator projects reported to us in our Preliminary Monthly Electric Generator Inventory.
- Macroeconomic assumptions: The macroeconomic assumptions in this month’s forecast were finalized prior to the Executive Order on February 1, 2025, that imposed a suite of tariffs on Canada, Mexico, and China and the subsequent pause on February 3 for U.S. tariffs on Canada and Mexico. The macroeconomic model we use in the STEO is based on S&P Global’s macroeconomic model, which this month assumed a 10% universal tariff and a 30% tariff on imports from China and does not reflect current policy. We will continue to monitor and will update our outlooks as policies change.
| Notable Forecast Changes | 2025 | 2026 |
|---|---|---|
Note: Values in this table are rounded and may not match values in other tables in this report. Percentages are calculated from unrounded values. |
||
| Distillate fuel oil inventories (million barrels) | 112.2 | 108.9 |
| Previous forecast | 118.4 | 114.4 |
| Percentage change | -5.2% | -4.8% |
| Henry Hub spot price (dollars per million British thermal units) | 3.80 | 4.20 |
| Previous forecast | 3.10 | 4.00 |
| Percentage change | 21% | 5% |
| U.S. secondary coal inventories (million short tons) | 95 | 73 |
| Previous forecast | 108 | 84 |
| Percentage change | -11.7% | -13.3% |
You can find more information in the detailed table of forecast changes.