Natural gas
Natural gas prices
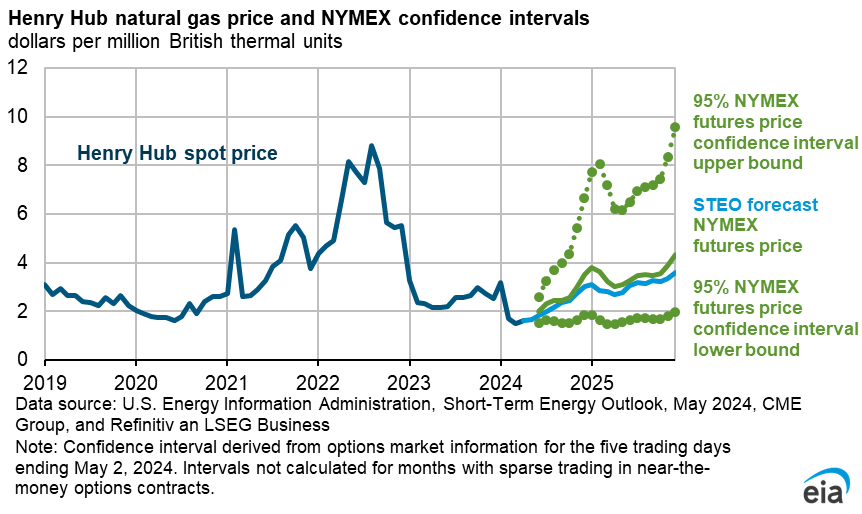
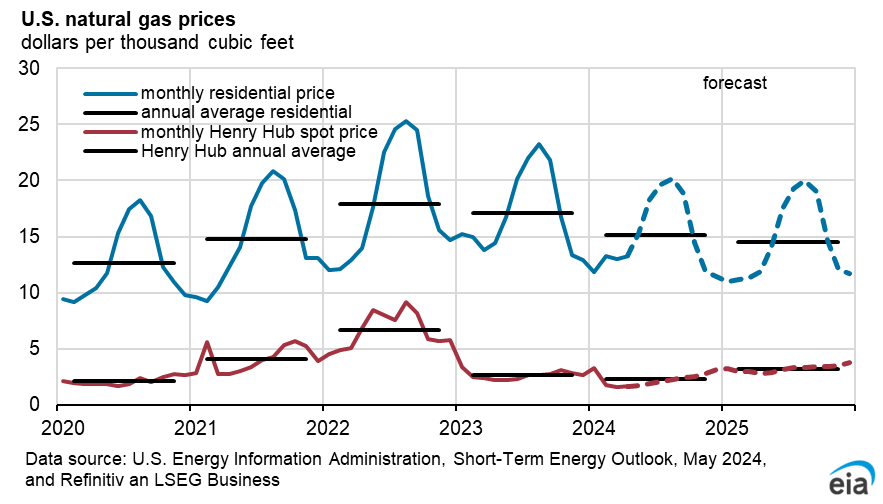
We expect that the Henry Hub natural gas spot price will average almost $2.90 per million British thermal units (MMBtu) in the second half of this year, up from an average of about $2.10/MMBtu in the first half of 2024 (1H24). Our July price forecast is similar to our June price forecast, which we increased from the prior month because of our revised forecast drop in U.S. natural gas production in 2024.
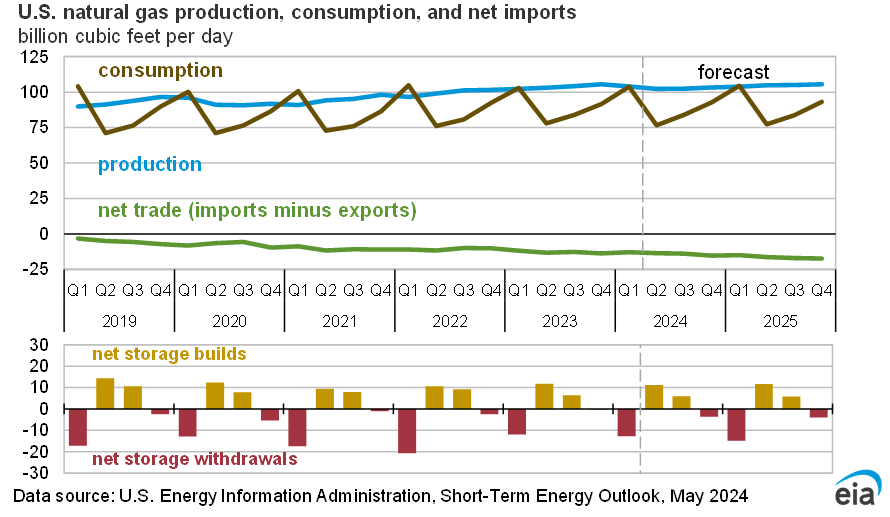
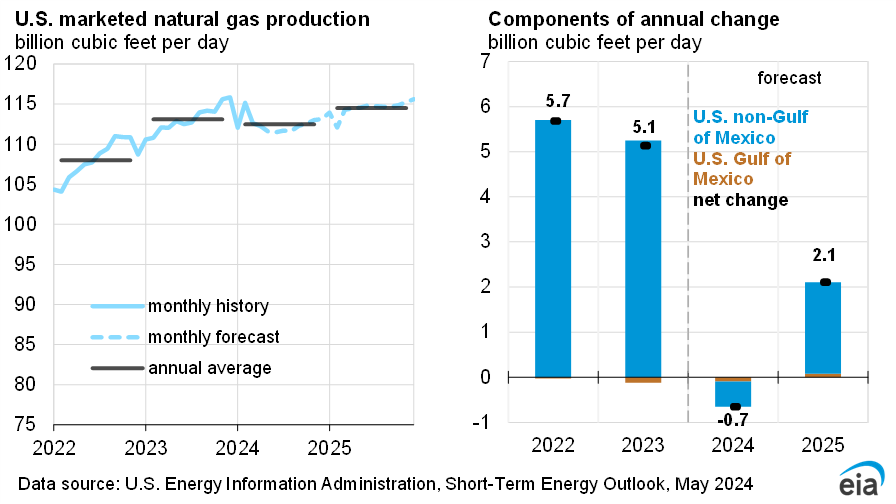
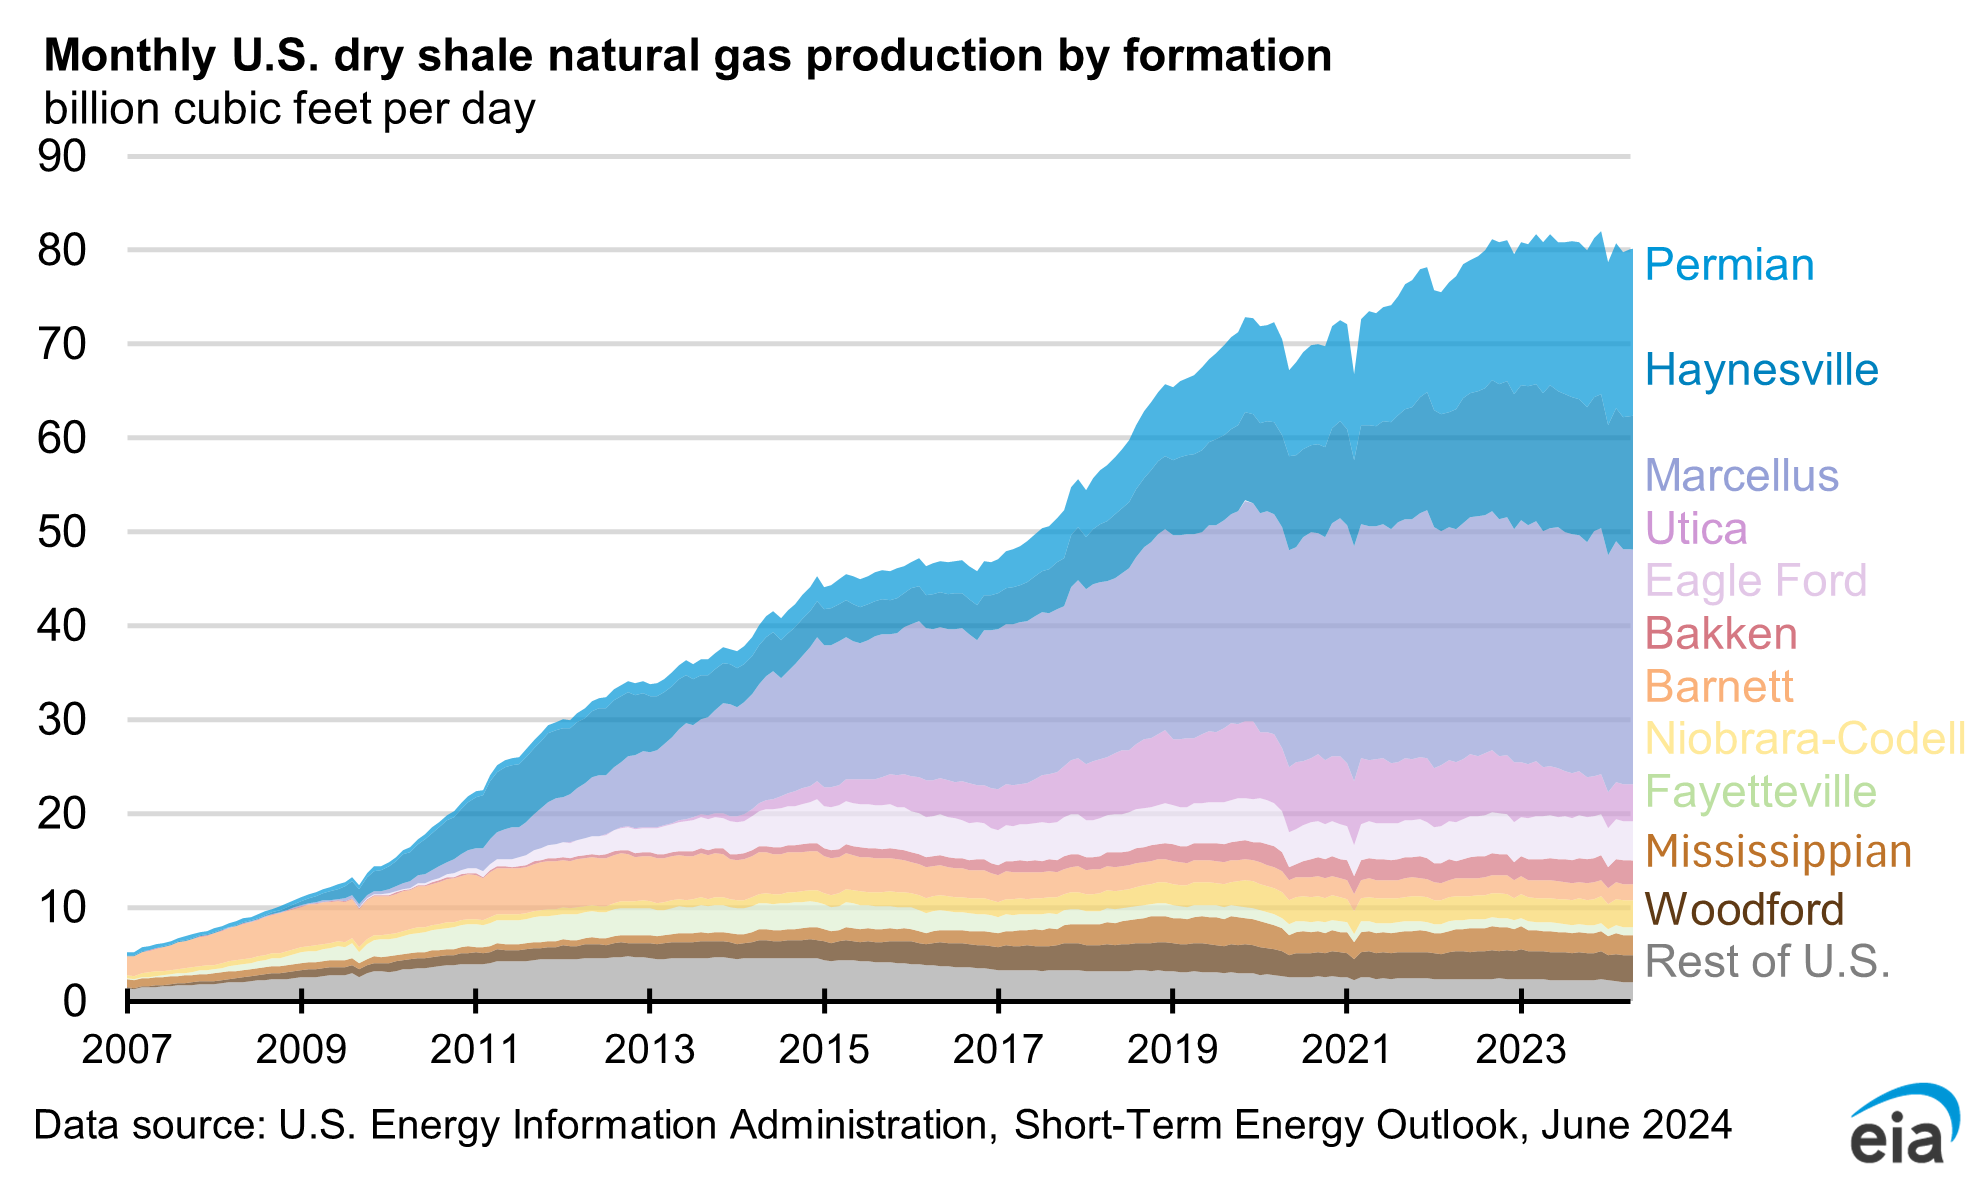
We expect U.S. dry natural gas production to decrease slightly in 2024 because of less natural gas-directed drilling and production curtailments in 1H24 due to low natural gas prices. Less production this year has helped keep natural gas injections into storage so far this injection season (April–October) below the five-year average (2019–2023).
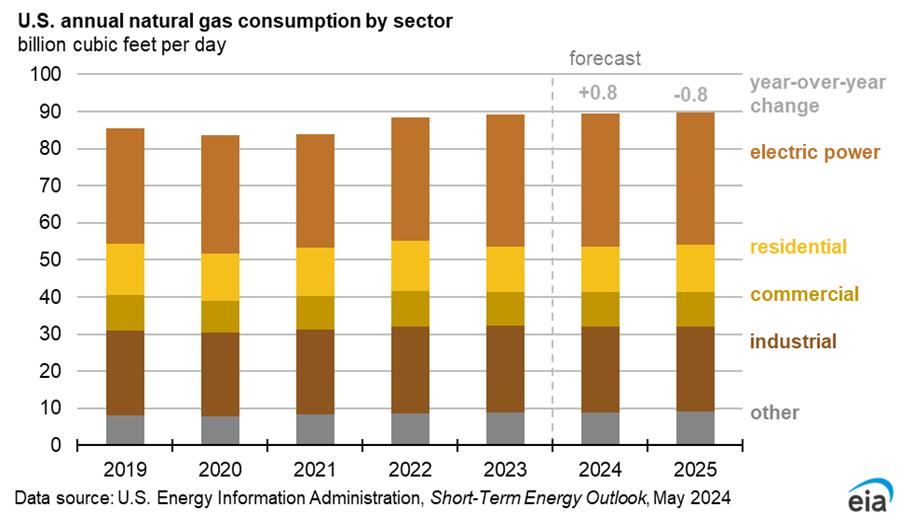
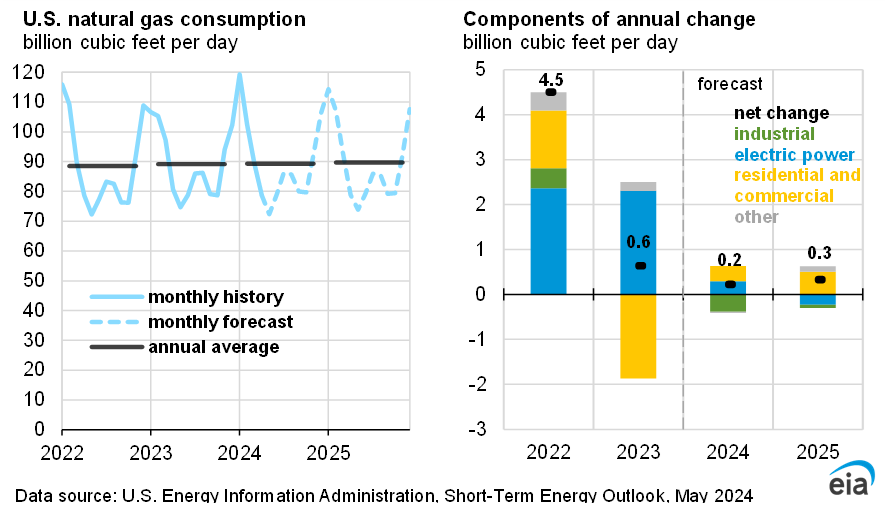
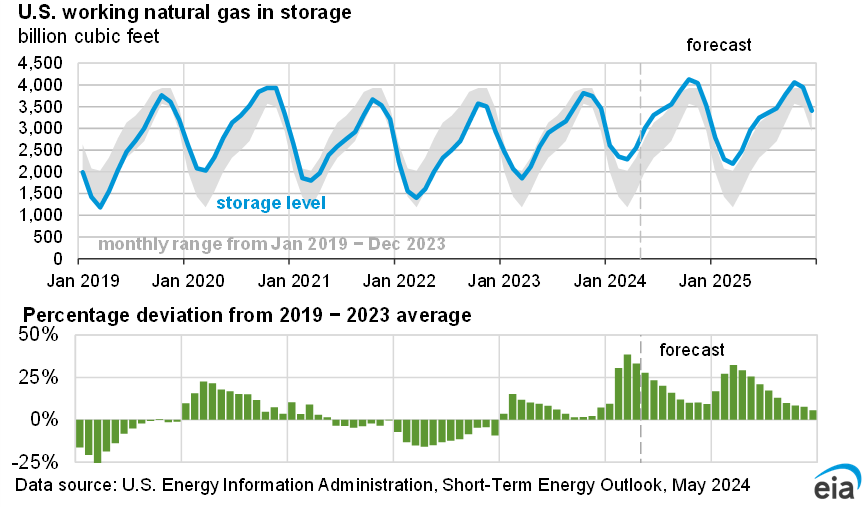
U.S. natural gas storage inventories were 19% above the five-year average (2019–2023) at the end of June after ending the withdrawal season on March 31 at 39% above the five-year average. We expect natural gas storage injections to continue to fall below the five-year average this injection season because of relatively flat production through 2H24 and a summer increase in demand from the electric power sector. As a result, the surplus of natural gas in storage will be further reduced, and we expect that inventories will end the summer injection season on October 31 at almost 3,970 billion cubic feet, still 6% above the five-year average and 4% more than inventories at the end of the 2023 injection season.
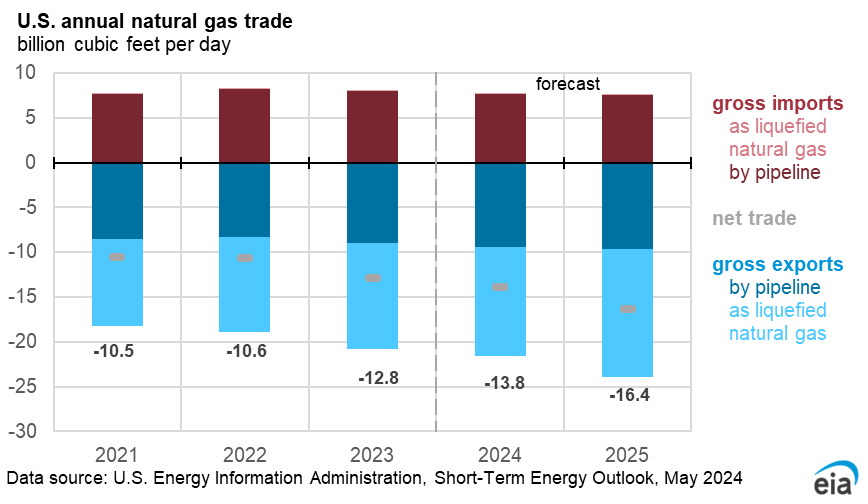
As U.S. storage inventories draw down close to the five-year average by the end of injection season and with new demand from liquefied natural gas export projects coming on line in late 2024 and mid-2025, we expect natural gas prices to rise to an average of $3.30/MMBtu in 2025. Because of rising prices, we expect dry natural gas production to increase by 2% next year.
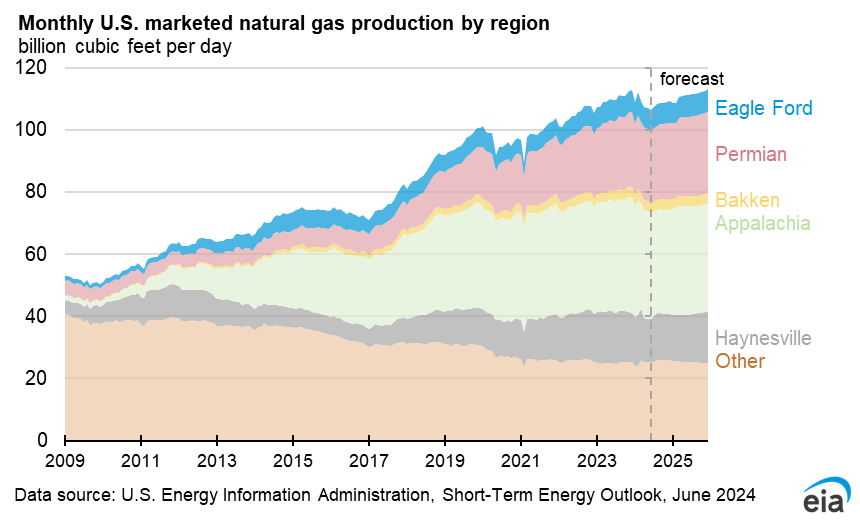
The Mountain Valley Pipeline in the Appalachia region, which provides additional takeaway capacity for natural gas production in the Appalachian Basin, started operations in June. We do not expect the full 2 billion cubic feet per day of capacity to be utilized until next year because of constraints downstream of the interconnection with the Transcontinental Gas Pipeline in Pittsylvania County, Virginia.
If production or storage injections are lower than our forecast and/or natural gas consumption in the electric power sector is greater than we expect, prices could be higher than in our forecast.